


Discrepancy in Expense Ratios for Same-Year Target Funds
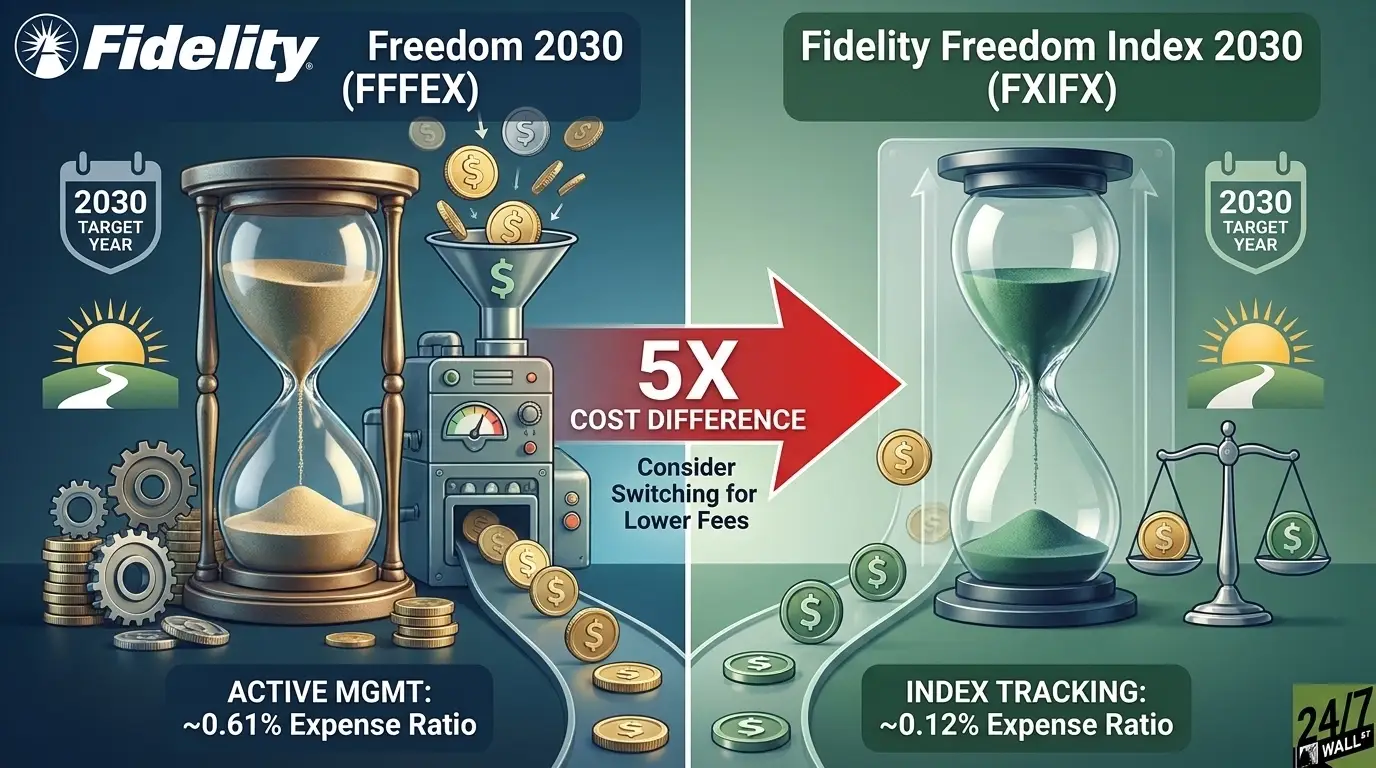
Fidelity offers two mutual funds designed for investors targeting the same retirement year, yet the funds carry significantly different cost structures. The Fidelity Freedom 2030 Fund, identified by the ticker symbol FFFEX, carries an expense ratio of 0.61%. A separate fund, FXIFX, shares a similar target date profile but charges an expense ratio of just 0.12%.
The difference in fees results in a cost disparity where FFFEX costs approximately five times more than FXIFX. According to data analyzed by 24/7 Wall St., this fee gap translates to a financial difference for investors holding substantial balances. On a $100,000 account balance, the annual cost of holding FFFEX is roughly $610, while holding FXIFX costs approximately $120. This creates an annual difference of about $490 in fees paid by the investor.
Reports indicate that many investors holding the higher-cost FFFEX fund are unaware that the lower-cost FXIFX option exists within their own retirement accounts, such as 401(k)s or Individual Retirement Accounts (IRAs). The similarity in the funds' names and target dates can obscure the distinction between the two products for account holders.
Performance Metrics and Allocation Differences
Historical performance data shows that FFFEX has outperformed FXIFX over a 10-year period ending in August 2026. Over this timeframe, FFFEX returned 139%, compared to a 130% return for FXIFX.
While the performance gap is evident, analysis suggests that the difference may not be attributable solely to manager skill. The funds utilize differing asset allocations, which can influence returns independently of active management decisions. The higher allocation to equities or other asset classes in one fund versus the other could account for part of the performance variance observed over the decade.
Frictionless Transition Options for Investors
For investors who identify they are holding the more expensive FFFEX fund, switching to the lower-cost FXIFX option is generally a straightforward process. Moving assets from FFFEX to FXIFX within a 401(k) or IRA typically triggers no capital gains tax. This tax-free transition removes a significant barrier for most holders, making the switch nearly frictionless.
The availability of the lower-cost alternative highlights the potential savings available to retirement savers. By switching from FFFEX to FXIFX, an investor could reduce their annual fee burden by approximately $490 per $100,000 invested, assuming equal asset allocation and market conditions.
Broader Context of Fidelity’s Fund Lineup
Fidelity’s fund offerings extend beyond the Freedom series. The company also manages the Fidelity 500 Index Fund (FXAIX), which holds approximately $832 billion in assets as of August 2026. FXAIX charges an annual expense ratio of 0.015%, which amounts to $15 on a $100,000 balance.
FXAIX does not require minimum investments or load fees at Fidelity. Over the same 10-year period ending in August 2026, FXAIX returned 313% through price appreciation alone, before the inclusion of reinvested dividends. This return would turn a $10,000 initial investment into roughly $41,000.
For investors utilizing taxable accounts rather than tax-advantaged retirement vehicles, other options such as the Vanguard S&P 500 ETF (VOO) or the iShares Core S&P 500 ETF (IVV) provide similar exposure to the S&P 500. These exchange-traded funds offer intraday tradability and specific tax efficiencies that the mutual fund structure of FXAIX cannot match.
The existence of multiple funds with similar names and target dates within the same financial institution raises questions about investor awareness. While the switch between FFFEX and FXIFX is technically simple and tax-free, the lack of awareness regarding the cost difference means many investors may continue to pay higher fees for identical retirement planning vehicles.